


![How to Find Low-Competition Keywords with Semrush [Super Easy]](https://static.semrush.com/blog/uploads/media/73/62/7362f16fb9e460b6d58ccc09b4a048b6/how-to-find-low-competition-keywords-sm.png)


![How Marketers Are Using AI for Writing [Survey]](https://www.growandconvert.com/wp-content/uploads/2025/03/ai-for-writing-1024x682.jpg)


![Ecommerce Customer Journey Mapping — How to Set Potential Shoppers Up to Buy [Tips & Template]](https://www.hubspot.com/hubfs/ecommerce-Sep-13-2023-09-08-01-7144-PM.png)


45+ Twitter (X) stats to know in marketing in 2025
The 2025 Sprout Social Index™ found that a whopping 93% of consumers want brands to keep up with online culture. And where better to Read more... The post 45+ Twitter (X) stats to know in marketing in 2025 appeared first on Sprout Social.

The 2025 Sprout Social Index™ found that a whopping 93% of consumers want brands to keep up with online culture. And where better to stay “in the know” than on X?
Despite significant changes, X (formerly known as “Twitter”) is still the hub of trending conversations. So understanding how people use the platform will help you tap into current events and emerging trends. This requires staying up-to-date on the latest Twitter stats to inform your approach.
When you have access to the latest social media stats about the platform, you get a better understanding of the trends shaping the online world. This helps you engage your audience in a way that resonates with them.
Check out these 45+ X statistics to inspire and guide your social media strategy this year.
General Twitter (X) stats every marketer should know
- Number of users worldwide: 415.3 million
- Monthly active users: 611 million
- Worldwide usage ranking: 12th most popular social network
- Ownership: Privately held
- Monetizable daily active users: 237.8 million
- Average daily usage: 11 minutes
- Average monthly time spent: 3.7 hours
- Worldwide daily engagement ranking: Seventh most-used social network
- Number of monthly website visits: 4.44 billion
- Website popularity ranking: Sixth most popular website
- Median engagement rate: 0.015%
- Median number of Tweets per week: 2.16
- Top content preference on X: Informative
- Number of X users using it as a news source: 59%
Between new ownership and major platform upheavals, X has been at a unique crossroads for the past few years. The platform’s complete rebranding and monthly verification fees initially turned users away from X.
Some projections even indicated a 5% decline in X monthly active users between 2022 and 2024.
(Pro tip: Use Twitter (X) analytics tools to track if these changes are affecting your brand’s audience performance.)
At the same time, we’ve also been witnessing a surge in user activity on the platform. With new content moderation policies in place, X is seeing increased engagement. Many of these engagements come from accounts that have been previously banned or restricted.
Owing to these changes, there are conflicting reports about how many people use X.
Despite the initial decline in users, things have slowed down since 2024. Statista is forecasting a 17.32% increase in users between 2024 and 2028. According to the report, there are currently 415.3 million X users worldwide. This indicates a gradual increase in X users over time in spite of the initial decline.
However, other reports put the platform’s monthly active user count at over 600 million. This would rank X as the 12th most popular social network based on the number of monthly active users.

Source: Statista
The platform also continues to see significant daily activity. According to the latest available data, there were 237.8 million monetizable daily active users on the platform in Q2 of 2022. That’s more than 57% of the platform’s users logging in daily.
This marked an increase from the previous quarter, where it had 229 million monetizable daily active users.
At the same time, people are spending less time on the platform and on social media as a whole. Oberlo reports that X users spend an average of 11 minutes per day on the platform. This is a sharp decline from previous years, when users would spend over 30 minutes per day on X.
The latest data from DataReportal also shows that users are only spending about 3.7 hours per month on the platform.
To coincide with this, some reports also reveal that people aren’t engaging as much on the platform. RivalIQ notes that the median engagement rate on X decreased from 0.029% in 2024 to 0.015% in 2025. Yet sports teams continue to see fairly higher engagement at a median of 0.073%.
Brands are also posting less frequently. The median Tweet frequency stands at 2.16 Tweets per week. This is a significant drop from the previous year’s median of 3.31 Tweets per week.
But this doesn’t negate the platform’s role in driving conversations around trending topics. X continues to be the top source of news among all social media sites. A 2024 study found that 59% of the platform’s users regularly use it to get news. This is likely why media companies have the most activity on X, Tweeting at a median of 49.90 Tweets per week. Sports teams come at a close second with 44.25 Tweets per week.
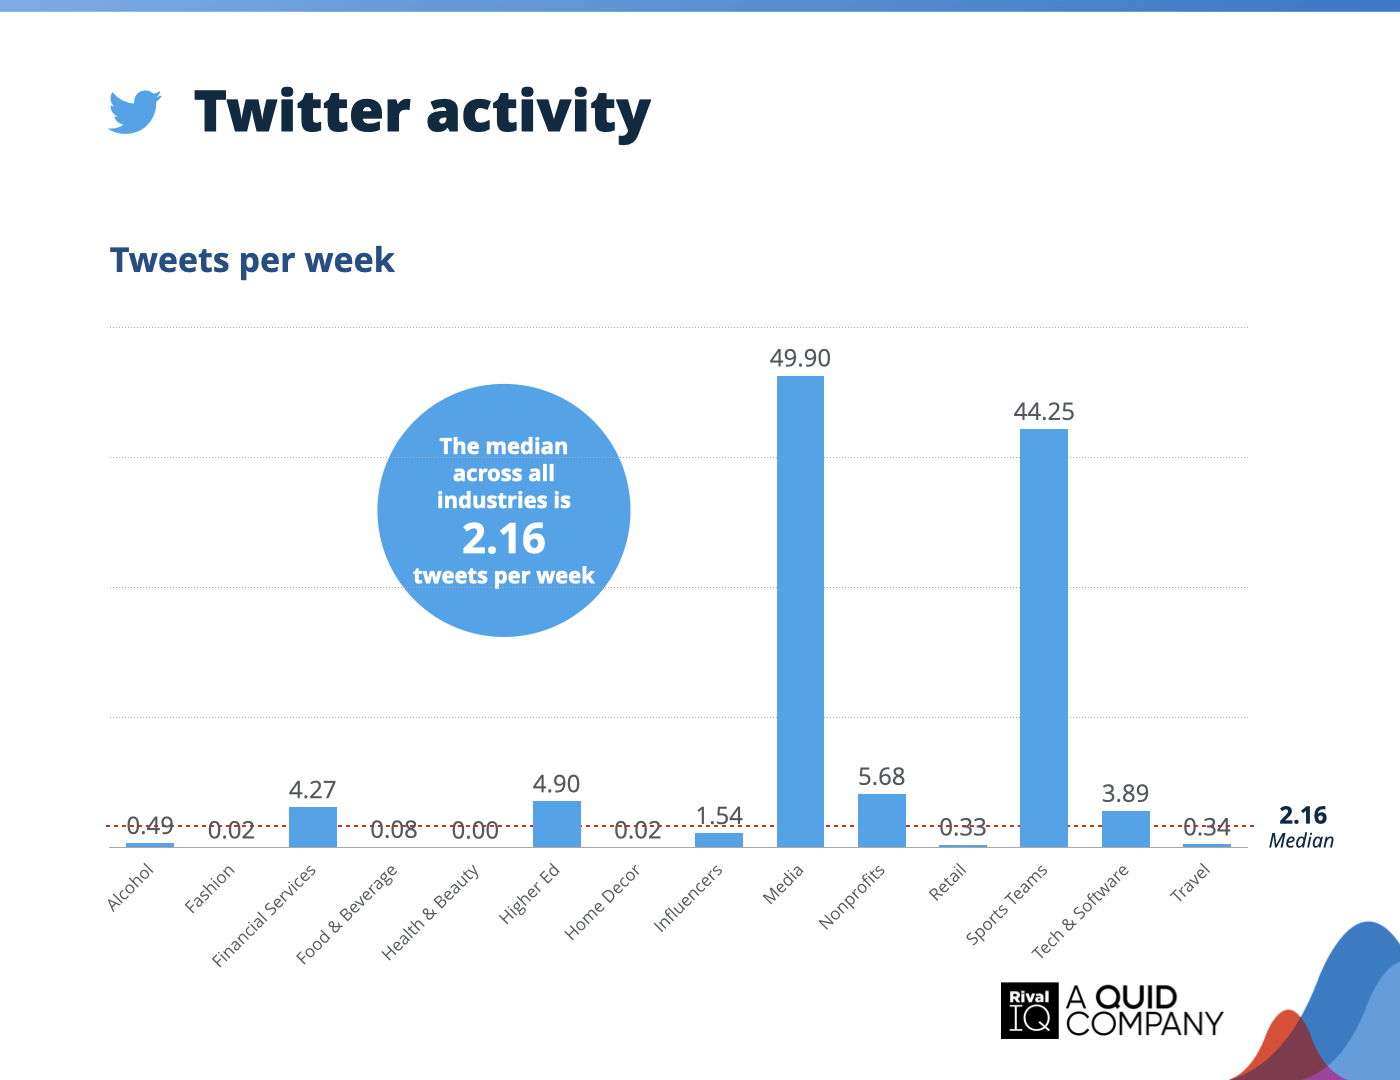
Source: RivalIQ
This finding is in line with X users having a preference for information-type content on the platform. About 55% of users prefer to see informative content. This makes it the most preferred content type. Additionally, users show a preference for relevant, engaging and trendy content. As such, brands using the platform can make a mark by participating in trending conversations.
X also continues to rank as one of the most visited social media sites. The X.com website sees a total of 4.44 billion visits a month, which makes it the sixth most popular website worldwide. X profiles ranking prominently in search results could be a key factor contributing to these visits.
Twitter (X) user statistics to help reach your audience
- Gender distribution: 60.9% male, 39.1% female (Note: Sprout Social acknowledges gender isn’t binary, but our data sources limit their reporting to male and female.)
- Age distribution: 36.6% between the ages of 25 and 34
- Top locations: United States, Japan, India
- Cross-platform usage: Instagram, LinkedIn and Facebook
- Education level and income: 27% of X’s user base are college graduates and 78% of its user base makes between $70,000 and $100,000 annually
- Top community: Suburban
- Social media users with an X profile: 48%
- Men are more likely than women to have an X profile
- What people use X for: Timely updates and news
To maximize your chance of reaching your target audience on X, you need to understand the demographic breakdown of its user base.
As previously mentioned, the platform tends to sway male, with 60.9% of users identifying as such. This trend continues even when you look at X demographics specific to the United States. Pew Research Center reports that 25% of adult men in the U.S. have used X. Only 17% of adult women in the U.S. say the same. This makes it one of the few social networks with more male than female users.

Source: Pew Research Center
When it comes to X age demographics, the platform’s popularity with Millennials hasn’t dwindled. It’s most popular with people between the ages of 25 and 34 years old and least popular with teens. Users within this age range are also most active on Instagram, LinkedIn and Facebook.
The Pew Research Center study noted that 27% of U.S. X users are college graduates. About 51% of the platform’s user base earns more than $70,000 annually while 27% make more than $100,000 annually. This highlights the platform’s highly-educated and high-earning base.
Moreover, X sees the most usage among suburban communities (23%). Urban communities follow close behind at 22%.
Countries leading in X usage include the U.S., Japan and India.
The good news for brands looking to engage their X target audience is that the core user base remains passionate about the network. Some brands were skeptical about the platform’s longevity after its transition to private ownership. Yet X’s core user base remains active.
Sprout Social’s 2024 Network Content Strategy Report notes that 48% of social media users have an X profile.
Our findings also show that users go to X for real-time updates and news, upholding its reputation as a news-breaker platform. This is particularly true for Baby Boomers. So news-worthy content and interesting updates are most likely to resonate with the X target market.
Twitter (X) stats businesses need to inform their strategy
- Best days to post: Tuesday, Wednesday, Thursday
- Most engaging hours: 9 a.m. to 3 p.m.
- Posting frequency for top brands: 4.2x per week
- Engagement rate for top brands: 0.08%
- Best performing content type: Text
- Number of users who interact with brand content daily: 35%
- Number of users who’ve engaged with a brand: 75%
- Why most users interact with brands: Entertainment and education
- Discoverability: #1 platform
- X users are 2x more likely to have made an in-app purchase
- X users are 36% more likely to be the first to try new things
- Number of users researching brands and products on X: 37.8%
- Number of users reaching out for customer care: 53%
- 64% of X users prefer sending a message than calling a business
- Expected response time: Three hours or less
When you build your Twitter marketing strategy, it’s imperative to align your content with the style of the network. For example, X is a fast-moving platform, and your X posts are easy to miss if you post at the wrong time.
According to the 2024 Network Content Strategy Report, Tuesdays, Wednesdays, and Thursdays are the best days to post on X.
As for timing, 9 a.m. to 3 p.m. tend to be the most engaging hours. But this may vary depending on the day of the week, with some days seeing engagements dwindle by noon. When in doubt, use your analytics to understand the best time to post on Twitter (X) for your business.

By sending out your Tweets at the best time, you can catch your audience when they’re most active. This allows you to drive higher engagements for your brand’s X account.
For context, RivalIQ reports that the top brands on X have an engagement rate of about 0.08%. So anything around this range should be a good engagement rate on the platform. Moreover, they Tweet at a frequency of 4.2 times per week. So the top-performing brands on X tend to be more active and post more often on average.
If you’re looking to ramp up your activity on the platform, your biggest focus should be on text posts. The 2024 Network Content Strategy Report found that X users are most likely to interact with text content from brands.
But make sure to mix things up a bit to keep your Feed fresh and engaging. Static images and short-form videos (<15 seconds) also see plenty of interactions on X.
So make sure to prioritize them for a powerful and dynamic social media content strategy.

In spite of the overall lower engagement on the platform, you’ll be happy to know that X users are still interacting with brands. According to the 2024 Network Content Strategy Report, 35% of X users interact with brands daily. And a Khoros study also found that 75% of users have used the platform to engage with brands.
Although news may be the top reason for using X, users also use the platform for entertainment. Connecting with friends and family and keeping up with influencers and celebrities are other popular uses.
But when it comes to their brand interactions, the platform’s purpose changes a bit. Consumers still seek out entertainment. However, they’re also most likely to engage with educational product content and contests and giveaways. This highlights the need for a strong edutainment social media content strategy to reach your X target audience.
With X users actively interacting with brands, it’s no surprise that the platform drives discoverability. According to internal data, X is the number one platform for discoverability. And its superpower is helping brands gain exposure to an audience eager to try something new. According to X, 36% of people on the platform are more likely to be the first to buy new products. They’re also twice as likely to have made an in-app purchase compared to users on other platforms.
Meanwhile, the DataReportal study also found that over 37% of X users research brands and products on the platform. This makes it the fifth most popular social network for brand research.
Consumers aren’t just on the platform for Twitter ecommerce, though. Many seek out brands to resolve care-related issues. The previously cited Khoros study found that 53% of X users who reach out to brands do so for this very reason.
This makes it the top social media platform for seeking customer care. The latest social media customer service stats also show that 64% of X users would rather reach out to a brand on X than call the business.
These numbers highlight how crucial it is for brands to provide assistance to their customers on the platform. But not just any assistance would do. Consumers are expecting brands to provide a swift response to their care-related issues.
The Khoros study reveals that 50% of X users expect a response to their complaint within three hours. This is regardless of whether they shared a complaint publicly or in a private message. Meeting this expected timeframe could improve loyalty to your brand. 45% of users also become more receptive to the brand’s advertisements.
As such, a positive Twitter customer service experience could easily sway buying decisions.

Source: Khoros
Twitter (X) statistics for advertisers
- Annual ad revenue: $3.14 billion
- Potential ad reach: 586 million
- Average ad cost (per first action): $0.26 – $1.50
- Typical monthly ad spend: $101 – $500
- Industry inclusivity: Only major social platform to allow cannabis advertising
Advertising on Twitter takes multiple forms. This includes Promoted X Posts, Timeline Takeovers and Dynamic Product Ads, among many others. The platform strives to continuously roll out new high-impact ad types to meet evolving consumer behavior.
In spite of this, ad revenue on the platform has witnessed a decline in the past couple of years.
According to a recent analysis, the platform generated $3.14 billion in ad revenue in 2024. This equals a 5% decline from the previous year. In 2025, X ad revenue could face a further decline of 4.8% at an estimated total of $2.99 billion.

Source: Oberlo
Despite the drop in ad revenue, X continues to be a prime platform for advertisers. According to DataReportal, the platform boasts 586 million monetizable monthly active users. That’s millions of people you could potentially reach with the right targeting strategies.
Plus, X offers some of the most cost-effective advertising solutions. A WebFX survey found that promoted X posts cost about $0.26 to $1.50 per action, with 54% of businesses spending this amount. This allows most businesses to keep their ad spend low. About 53% of businesses spend between $101 and $500 on X advertising.
In addition to the low ad cost, X is making attractive appeals for brands to reinvest in the platform. One of these initiatives includes allowing cannabis advertising. (If your brand sells cannabis, bookmark our article: How cannabis brands elevate their social media content.)
Twitter (X) influencer statistics
As brands continue to explore influencer marketing strategies, understanding how X influencers perform compared to those on other platforms is crucial for social media managers and digital marketing professionals. Below, we break down key metrics like engagement rates, cost per post and audience reach to help you make informed decisions about leveraging X influencers in your campaigns.
44. Twitter (X) influencers have a lower engagement rate compared to other platforms, but video content performs notably better
Engagement rate is one of the most critical factors in determining an influencer’s effectiveness. According to our data from Sprout Social Influencer Marketing, the average engagement rate per post from an X influencer in 2024 was 0.09%.
- Photo posts had an engagement rate of 0.08%.
- Video posts performed significantly better, with an engagement rate of 0.42%.
- Text posts saw a slightly higher engagement rate than photo posts at 0.1%.

Compared to platforms like Instagram (1.8%) and TikTok (2.18%), X influencers see lower engagement rates, particularly on static posts. However, video content on X from influencers performs significantly better than other content types, making it a strategic format for brands aiming to maximize engagement.
45. Influencer partnerships on Twitter (X) are cost-effective
Cost-effectiveness is another crucial factor in influencer marketing, and X influencers tend to be on the lower end of the influencer pricing spectrum compared to platforms, like Instagram or YouTube. Based on our data from Sprout Social Influencer Marketing, here’s the breakdown of average costs per post on X:
- Nano-influencers: $11
- Micro-influencers: $60
- Mid-tier influencers: $550
- Macro-influencers: $1,500
- Mega-influencers: $11,000
- Celebrities: $22,000
For brands with a limited budget, X provides an opportunity to work with influencers at a lower cost while still reaching engaged audiences—particularly through video content.
46. The U.S. and UK are the top-performing markets for Twitter (X) influencer engagement
For marketers targeting international audiences, understanding engagement distribution by country is essential. According to Sprout Social Influencer Marketing data, the United States led X influencer engagement in 2024 with 37 billion engagements, followed by:
- UK: 5.9 billion engagements
- Brazil: 4.86 billion engagements
- Canada: 2.9 billion engagements
- India: 2.45 billion engagements
This shows us that X influencer engagement is most significant in the U.S. and the UK, making them key markets for brands looking to leverage influencer marketing on the platform. We recommend considering partnerships with X influencers native to these countries if your target international audience is among them. Choosing influencers that are local to your audience has a much greater impact on engagement than if they’re from an area different than your audience.
What to do next with these Twitter marketing statistics
X’s popularity and usage may have dropped in the past couple of years. But these key X stats show that the platform still plays a vital role in social media marketing.
Even in the midst of the platform’s evolution, you can find stability and success if you ground your strategy in data. Use the 45+ X marketing statistics we shared in this article to build a strategy that resonates with your target audience.
Ask questions like:
- What does my target audience use X for?
- Am I reaching my audience at the best time?
- What type of content does my audience like to interact with?
- Is my company’s X customer service workflow meeting expectations?
Use your answers to guide your company’s approach to the platform in 2025, and watch your presence take off. Discover more best practices and tips in our comprehensive guide on using Twitter (X) for business.
The post 45+ Twitter (X) stats to know in marketing in 2025 appeared first on Sprout Social.