


![How Marketers Are Using AI for Writing [Survey]](https://www.growandconvert.com/wp-content/uploads/2025/03/ai-for-writing-1024x682.jpg)


![31 Top Social Media Platforms in 2025 [+ Marketing Tips]](https://static.semrush.com/blog/uploads/media/0b/40/0b40fe7015c46ea017490203e239364a/most-popular-social-media-platforms.svg)


![Gated Content: What Marketers Need to Know [+ Examples]](https://www.hubspot.com/hubfs/UNGated%20Content.png)


31 Facebook statistics marketers should know in 2025
Should your brand be putting Facebook first? Are your content and ads targeting the right audience? Well, staying up-to-date on the latest social media Read more... The post 31 Facebook statistics marketers should know in 2025 appeared first on Sprout Social.

Should your brand be putting Facebook first? Are your content and ads targeting the right audience?
Well, staying up-to-date on the latest social media statistics for Facebook can clue you in!
While other apps are in the spotlight, Facebook is still the most popular social media platform. The size and scope of its users in 2025 may surprise you, especially versus its competitors.
This post breaks down key Facebook marketing statistics including new data on demographics, usage, marketing and more.
Top 3 Facebook stats every marketer should know
- Facebook is the third most-visited website behind Google and YouTube as of 2025. This puts Meta’s mainstay network ahead of other leading platforms like TikTok and Instagram.
- The platform boasts 3.06 billion active users every month. This makes Facebook the most used social media platform worldwide.
- In 2024, Facebook’s total ad revenue amounted to $164.5 billion, up from $134 billion the previous year.
Facebook usage statistics
Facebook is synonymous with social media itself. It continues to be the biggest social media platform and remains widely popular on a global scale for consumers and marketers alike.
Let’s kick things off with key Facebook usage statistics to understand its popularity and inform your own Facebook marketing strategy:
1. Facebook hit 3.065 billion monthly active users in 2024
By Q2 2024, monthly active users on the platform had grown to 3.065 billion after reaching the 3 billion user milestone a year prior.

Although adoption has slowed down, monthly and daily usage is still seeing an upward trend. If your marketing efforts are also feeling stagnant, download our Facebook marketing template to reinvigorate your strategy.
2. Americans spend approximately 30.8 minutes on the platform daily
On average, American users spend about 30.8 minutes on Facebook daily. This puts it below other platforms including TikTok, Instagram and even X. These numbers suggest that the platform is still seeing a high level of usage but less daily engagement compared to other networks.
Facebook user statistics
Facebook may have billions of users, but how are people actually using the platform? These Facebook user statistics can help us to find out:
3. 3.35 billion users are active daily on the Facebook family of apps
According to Meta, 3.35 billion people spend at least some amount of time daily on its suite of apps including Facebook, Instagram and Messenger.
Believe it or not, there are billions of people your brand could potentially reach every single day via Facebook. The key is to get ahead of the Facebook algorithm so you can boost your organic visibility.
4. 90% of social media consumers have a Facebook profile.
While social platforms come and go, Facebook is still a staple of the average consumer.
According to the most recent Sprout Social Index, Facebook is the most popular social media network among all consumers surveyed. Respondents said if could only use one social media network, they said they would choose Facebook.

5. Facebook is the most popular site for people to get their news
The rise of social media as an information source isn’t breaking news by itself.
However, the fact that Facebook is the top social media platform for people to get their news might be a surprise.
From local headlines and politics to pop culture and beyond, nearly two-thirds of users (63%) rely on the platform for news updates.
6. Facebook is the second most popular platform for product discovery
Recent Facebook statistics highlight how Meta has a strong hold on social commerce.
Facebook (60%) comes in second only by one percentage point to Instagram (61%) as the most popular platform for product discovery according to our data. Given the boom of ads across Meta’s suite of apps, this makes perfect sense.
Fun fact: Sprout Social also found that nearly 40% of Gen X consumers use the platform to make purchases. There’s no denying that Facebook remains a go-to platform for social product discovery.

7. 44% of Facebook users interact with brand content on the network at least once a day
Social media is commonly used for customer support and customer care requests.
Even though Facebook is a social network, it can still be a great outlet for providing customer support and improving experiences with your brand. Our data shows that 76% of consumers notice and appreciate when companies prioritize customer support, regardless of network.
8. Facebook is projected to convert 38.5% of US users to buyers this year
According to eMarketer, US adults were more likely to purchase directly on Facebook in 2025. However, this puts them behind TikTok (45.5%) and just slightly ahead of Instagram (37.3%).
Given the rise of TikTok Shop, this stat might not be too shocking. That said, Facebook still has its own social commerce powerhouse in the form of Facebook Marketplace.
9. 40% of Facebook’s user base actively shop on Facebook marketplace
Data from Capital One highlights the boom of Facebook Marketplace and its millions of shoppers (and billions of transactions). The report also notes that approximately 16% of active Facebook users exclusively have a presence on the platform to use its Marketplace features.
Facebook audience and demographics statistics
Wondering if you’re reaching the right audience on Facebook? What if your target demographic isn’t even on the platform?
Here are a few Facebook stats breaking down the platform’s core audience and demographics:
11. Gen X represents Facebook’s largest audience
Remember when we said that 90% of consumers have a Facebook profile? Facebook is used most by Gen X, followed by Baby Boomers and Millennials. This varies for Gen Z, who is most likely to have Instagram (89%), YouTube (84%) and TikTok (82%) profiles instead.
12. Facebook is the most popular channel for customer care among millennials, Gen X and Baby Boomers
Facebook gives users a direct line to businesses via Messenger, Groups, Events and more. That’s why it’s the most popular channel for customer care across millennials, Gen X and Baby Boomers.

Having a presence on the platform is pretty much non-negotiable no matter who your target audience is. Given that 73% of consumers claim they’ll bounce to a competitor if they don’t receive timely customer care, brands can’t afford to ignore Facebook as a service channel.
13. Mothers in the US spend 2.3x the time on Facebook than they do on TikTok
According to recent Comscore data via eMarketer, moms across demographics are glued to Facebook and Facebook Messenger. Facebook groups for mothers dominate the platform, which may come as a surprise given the popularity of #MomTok and other niche communities on other platforms.
14. Facebook has more male-identifying users than female
Facebook currently limits its reporting to male and female. And based on the data, the platform has a higher percentage of male users (56.8%) than female users (43.2%).
15. India has the largest Facebook audience size
While Facebook sees significant usage across various countries, India has the greatest number of users. Latest reports show that there are 378.05 million Facebook users in India. The United States comes next, with 193.8 million users.
Facebook advertising and marketing statistics
Is Facebook marketing still worth it? And are you getting the most out of your Facebook advertising strategy? Check out these Facebook ads statistics to understand advertising impact on the platform.
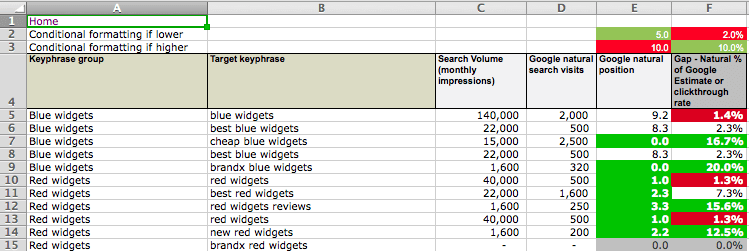
16. Facebook ads see an average click-through rate (CTR) of 2.53%
According to a WordStream study, Facebook ads get an average CTR of 2.53% across all industries for lead-gen ads. That said, click-throughs vary for industries, with arts & entertainment and real estate among the highest.

Facebook traffic ads and campaigns see a lower CTR, with the average rate being 1.57% across all industries. Arts & entertainment, real estate, restaurants & food and travel all see a CTR above 2%.
17. Advertising for traffic campaigns on Facebook costs $0.77 per click
The same study found that the average cost per click (CPC) is $0.77 across all industries for traffic ads which is down from the previous year. The average cost per click is $1.88 for lead gen ads, also down slightly from $1.92 last year.
However, you can expect to pay much more in certain industries or campaign ads. For example, lead gen ads have a CPC of $8+ for attorneys and $4+ for dentists and physicians.
18. The average conversion rate on Facebook is 8.78% across industries
Facebook sees a fairly high conversion rate for ads on the platform. On average, you can expect a conversion rate of about 8.78% for your Facebook ad. The specifics vary depending on your industry, though. Dental services, industrial & commercial and real estate sectors see higher conversion rates.
19. Facebook is among the top three ROI drivers for marketers
With such high conversion rates and low CPC, marketing on Facebook yields high returns. In fact, 40% of marketers cite Facebook as one of their top three drivers of ROI when it comes to social media platforms.
Facebook engagement statistics
With organic visibility on Facebook on the decline, it’s only natural to see a drop in engagement levels as well.
But does this put Facebook at a disadvantage over other social media platforms?
Here’s a quick look at some vital stats to understand where Facebook engagement currently stands:
20. The average engagement rate on Facebook is 0.063%
According to a SocialInsider study, brands see a median Facebook engagement rate of 0.015% across all industries. This puts Facebook as one of the less engaging social media platforms, neck-in-neck with X.
21. Albums and photo posts have the highest engagement
The power of visuals is still evident on Facebook, with album posts getting just below 0.15% engagement. Video posts come next with an average engagement rate of 0.12%. Status posts perform fairly well with an average engagement rate of 0.11%. Link posts, on the other hand, are the worst for driving engagement. They see an average engagement rate of only 0.04%.

22. Frequent posting doesn’t result in higher engagement
Contrary to popular belief, posting frequently doesn’t necessarily result in higher engagement. As a RivalIQ study points out, influencers and the higher education industry see the greatest engagement compared to their posting frequency.
For example, influencer pages publish just ~4 posts per week but earn some of the highest engagement on the platform. Meanwhile, higher education companies companies publish 6+ posts a week and see similar numbers.
The takeaway? It’s about your audience and industry, not hitting an arbitrary post count.
Rather than post frequency, post publishing should be a factor in your strategy. Know the best time to post on Facebook so you stand a better chance of driving engagement.
Facebook video statistics
As video marketing continues to gain popularity, it’s important to be aware of how video performs on Facebook. Here are some key Facebook video statistics to inform your strategy:
23. 40% of the time users spend on Facebook and Instagram is watching videos
Even with the boom of short-form video platforms like TikTok, approximately 40% of time spent on Facebook (and Instagram) is watching video content. This means your audience likely watches video content on the app, and creating Reels can help you reach more people. We’ve created a quick guide on creating a successful social media video strategy, if you need a refresher.
24. Vertical video with audio sees 12% higher conversions
Facebook Reels have been popular on the app since they were created and integrated into the app from Instagram. Facebook discovered that vertical videos (Reels) with audio see a 12% higher conversion rate than other types of video content on the platform.

Facebook feature stats (Reels, Stories, Messenger)
So, what sort of content should you post? What features are growing and what are stagnant? Let’s review some Facebook stats that break down some of the platform’s key features, like Facebook Stories, Reels and Messenger:
25. More than 500 million people still use Stories every day
According to internal Facebook data, half a billion people use Facebook Stories each day and more than 1 billion Stories are shared every day across the Meta apps. Meanwhile, the feature attracts 4+ million advertisers every month.
This speaks to the popularity of the platform’s feature, making it a useful tool for brands to engage their audience.
26. Facebook Messenger has 194 million users in the US
On its own, Facebook Messenger boasts 194 million users in the US as of January 2025. That’s almost 200 million people you could potentially reach through ads on Messenger.
27. Users reshare 3.5 billion Reels daily across Facebook and Instagram
The popularity of Reels isn’t dying out anytime soon.
Last year, we learned that Reels see about 200 billion views daily across the Facebook family of apps. Fast-forward to 2025 and 3.5 billion Reels are shared daily across Meta.

With algorithms further pushing this format, Reels could help you gain visibility and engagement. Brands can’t afford to put this short-form video format on the back burner.
Facebook influencer statistics
Facebook remains a key platform for influencer marketing, but how does it truly perform? While the platform boasts massive reach, engagement rates tend to be lower than on video-centric platforms like TikTok and Instagram. We’ve broken down the most critical insights from Sprout Social Influencer Marketing data on engagement, cost per post and audience interactions.
28. Facebook influencer engagement rates are relatively low compared to other networks
Engagement rate is one of the most telling metrics for influencer marketing success, as it reflects how audiences interact with content.
According to our Sprout Social Influencer Marketing data, the average engagement rate per post from a Facebook influencer in 2024 was 0.11%.
Engagement rates vary by post type:
- Reels outperformed all other post types, with an average engagement rate of 0.23%.
- Videos had a 0.17% engagement rate.
- Photo posts lagged at 0.08%.
- Text posts had the lowest engagement, averaging 0.07%.

This shows the growing dominance of short-form video content (Reels) for Facebook influencer marketing. As part of your influencer marketing strategy on this network, prioritize more dynamic and engaging video collaborations for maximum engagement. This, along with making sure your content is relevant to your target audience, can boost the engagement of your influencer marketing campaigns on Facebook.
29. Facebook nano- and micro-influencers provide substantial ROI
Understanding pricing expectations is crucial for budgeting influencer marketing campaigns. Here’s a breakdown of the average cost per post based on Facebook influencer tier from 2024:
- Nano-influencers (1K–10K followers): $137.50
- Micro-influencers (10K–50K followers): $750
- Mid-tier influencers (50K–500K followers): $6,875
- Macro-influencers (500K–1M followers): $18,750
- Mega-influencers (1M+ followers): $137,500
- Celebrities: $275,000
When compared with platforms like TikTok and Instagram, top-tier influencers on Facebook come with a higher price tag. But if you’re looking to maximize your budget, nano- and micro-influencers on Facebook can be a cost-effective entry point for influencer campaigns on this social network. Nano- and micro-influencers not only come at a lower cost per post but also have highly engaged, niche audiences and more genuine connections than creators with larger followings.
30. Facebook influencer content generated $63.1 billion in Earned Media Value in 2024
In 2024, the total Earned Media Value (EMV) of all Facebook influencer posts was valued at $63.1 billion, according to Sprout Influencer Marketing data.
With $63.1 billion in EMV on Facebook in 2024, you’ll see that influencer content is still a powerhouse for brand exposure. Even though engagement rates on the platform are relatively low, the impact is undeniable.
31. The U.S., India and Latin America show the highest levels of Facebook influencer engagement
Global reach is a major advantage of Facebook, but engagement levels vary by region. Our Sprout Influencer Marketing data shows the top five countries with the highest engagement from Facebook influencer content in 2024:
- United States: 4.84 billion engagements
- India: 1.43 billion engagements
- Mexico: 1.41 billion engagements
- Brazil: 1.1 billion engagements
- Italy: 1.05 billion engagements
The U.S. leads by a significant margin, but specifically Mexico and Brazil also show strong engagement levels. Facebook users in these regions are highly engaged with influencer content. This means localized partnerships for these target countries can drive stronger brand affinity and higher conversion rates.
How do these Facebook stats inform your social media strategy?
These Facebook statistics show that the platform is thriving for marketers and consumers alike. We hope you have a better idea of what types of content, ads and messaging make the most sense for your brand and its specific audience. If you want to take your strategy to the next level when it comes to engagement and efficiency, check out these Facebook marketing tools that can help!
The post 31 Facebook statistics marketers should know in 2025 appeared first on Sprout Social.
